
Meet the accelerated learning program that will turn you into a new professional and unlock your access to great opportunities with Data Analytics
…Become valuable to your employer
Our Students Work Here...
Partners:


This Course Helped Me to Restart My Career
”It was indeed an eye-opener for me . I delved into DATA ANALYTICS with the help of 720DEGREEHUB. I’m proud to be independent now. i love it”
Gideon Ogunkola
Dear Professional Data Analyst-To-Be,
Whether you’re interested in building a career as a Data Analyst, you’re underemployed and need a better skill that give you the chance to earn good pay in high-profile industry.
You’re a graduate who is toiling hard to get a decent job or you’re frustrated with your low earnings and needs a profession that could earn you huge income in less time.
Then, this training is for you….
Did you know that skilled DATA ANALYSTS are in high demand and one of the most valuable professions in the world?
According to World Economic Forum, in 2021, Data Analytics made one of the 10 most valuable and highly in-demand skills in the World.
Harvard Business Review has named Data Analytics in the last 3 years in US as “The Most Sexy Profession” which means many Data Analysts have become the “Darling” of most employers.
Average annual salary of a Data Analyst is estimated at $73,000 as revealed by indeed.com
Data Analytics MasterClass worth ₦150,000 just ₦25,000 For Two month
( 8 Weekends Class ).
Power BI - 15,000 NGN for 1 month
Power BI + SQL - 25,000 NGN for 2 months


Through this training, You’ll discover how to take raw data, understand patterns, build models, extract valuable insights and turn them into actionable decisions for business success.
But here’s the problem you face; most people think that using data to make informed decisions is so difficult and takes so long they can’t imagine becoming a Data Analyst which means you’ll keep depriving yourself outstanding opportunities to earn huge income and become indispensable in the business world.
Luckily for you, there’s now a solution.
Did you know that skilled DATA ANALYSTS are in high demand and one of the most valuable professions in the world?
This revolutionary course helps you work on data, create tons of reliable information that result into increasingly huge business success.
This course will give you the tools, strategies and plans you need to get ahead and stay ahead, right now and in the future.
You’ll gain a solid grounding in the techniques used for pre-processing, processing and analysing data.
You’ll gain a clear understanding of both the potential and the advantages of business intelligence when it comes to data analysis.
This live training reveals how to conduct data analysis by learning how to analyze data.
That includes knowing how to import data, explore it, analyze it, learn from it, visualize it, and ultimately generate easily shareable reports.
What's included?
The Curriculum
PROJECT OBJECTIVE #1: Connect & Transform the Raw Data
- Intro to the Power BI Query Editor
- Types of Power BI Data Connectors
- Basic Table Transformations
- Text, Number & Date Tools
- Index & Conditional Columns
- Grouping & Aggregating Data
- Pivoting & Unpivoting
- Modifying, Merging & Appending Queries
- Connecting to Folders
- Defining Hierarchies & Categories
- Query Editing & Power BI Best Practices
PROJECT OBJECTIVE #2: Build a Relational Data Model
- Intro to Database Normalization
- Data ("Fact") Tables vs. Lookup ("Dimension") Tables
- Creating Power BI Table Relationships
- "Star" vs. "Snowflake" Schemas
- Active vs. Inactive Relationships
- Relationship Cardinality
- Connecting Multiple Data Tables
- Filtering & Cross-Filtering
- Hiding Fields from the Power BI Report View
- Data Modeling & Power BI best Practices
PROJECT OBJECTIVE #3: Add Calculated Fields with DAX
- Intro to Data Analysis Expressions (DAX)
- Calculated Columns vs. Measures
- Row Context vs. Filter Context in Power BI
- DAX Syntax & Operators
- Common Power BI Functions
- Basic Date & Time Formulas
- Logical & Conditional Statements
- Joining Data with RELATED
- CALCULATE, ALL & FILTER Functions
- DAX Iterators (SUMX, AVERAGEX)
- Time Intelligence Formulas
- DAX & Power BI Best Practices
PROJECT OBJECTIVE #4: Design Interactive Power BI Reports
- Intro to the Power BI Report View
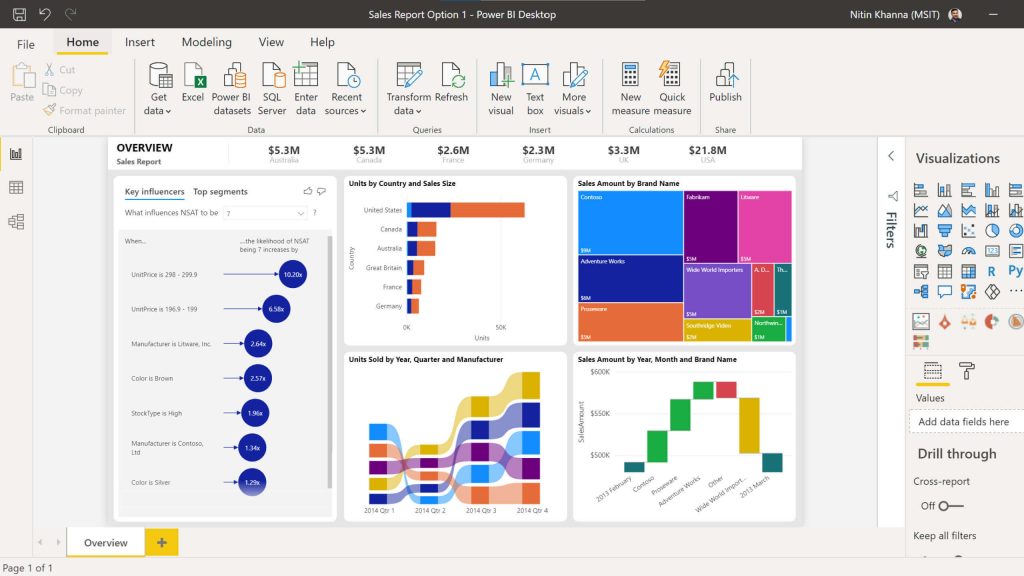
- Adding Basic Charts to Power BI Reports
- Formatting & Filtering Options
- Matrix Visuals
- Slicers & Timelines
- Cards & KPIs
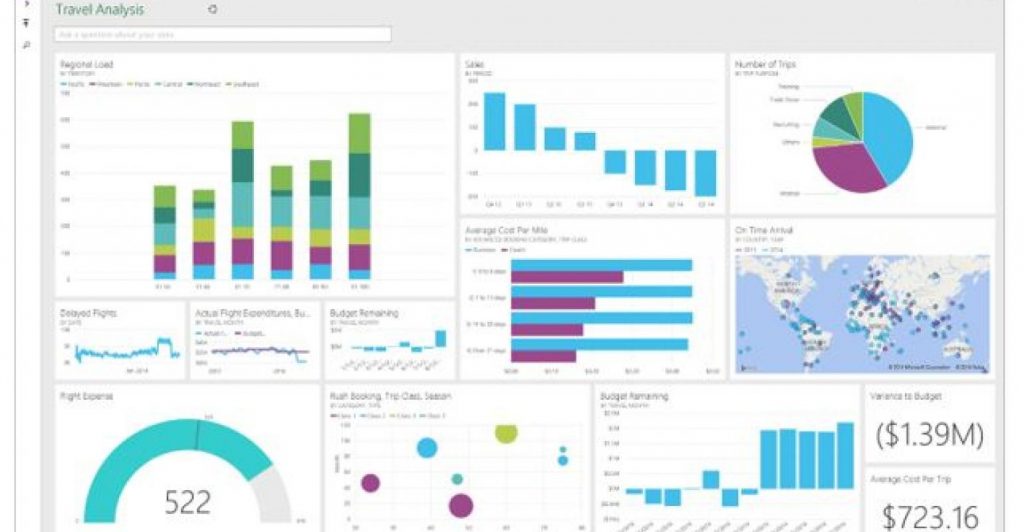
- Power BI Map Visuals (Basic, Fill, ArcGIS)
- Treemaps, Lines, Areas & Gauges
- Editing Report interactions
- Adding Drillthrough Filters
- Linking to Report Bookmarks
- Using "What-If" Parameters
- Managing & Viewing Roles
- PREVIEW: Publishing to Power BI Service
- Power BI Data Viz Best Practices
Lots of Bonuses for you...
- 100+ page Power BI ebook
- Downloadable Power BI project files
- Homework exercises & quizzes
- 1-on-1 expert support
- Course Q&A forum
- 30-day money-back guarantee
- Real Life Datasets
- Live Recorded Videos for you
- Collections of Videos for you
Learn DATA ANALYTICS irrespective of your field of study DATA ANALYTICS makes you valuable in this present world.
About the Course.
The Data Analytics / Business Intelligence industry is booming and every day, more hiring managers and recruiters are looking for employees who knows their ways around BI tools, the certification is also important to back up your skills.
Knowing this, what are you doing to let recruiters know you mean business?
Becoming Data analyst is a must if you want to be competitive in the job market. Employers need to know that you can analyze their data without training you irrespective of your job position. This training do just that – they endorse the skills that can’t be measured on a resume, portfolio or in an interview.
By mastering Data Analytics using Power BI, you become more efficient and valued at work and able to communicate and uncover deeper insights to develop your organization. You also gain the confidence to lead more projects and solve complex business challenges. And that is where this training comes into play.
The Data analytics Training designed for fresh graduates, unemployed and underemployed no matter your discipline. So, you can jest assure that everything that is needed to equip you and become the best is packaged in this training.


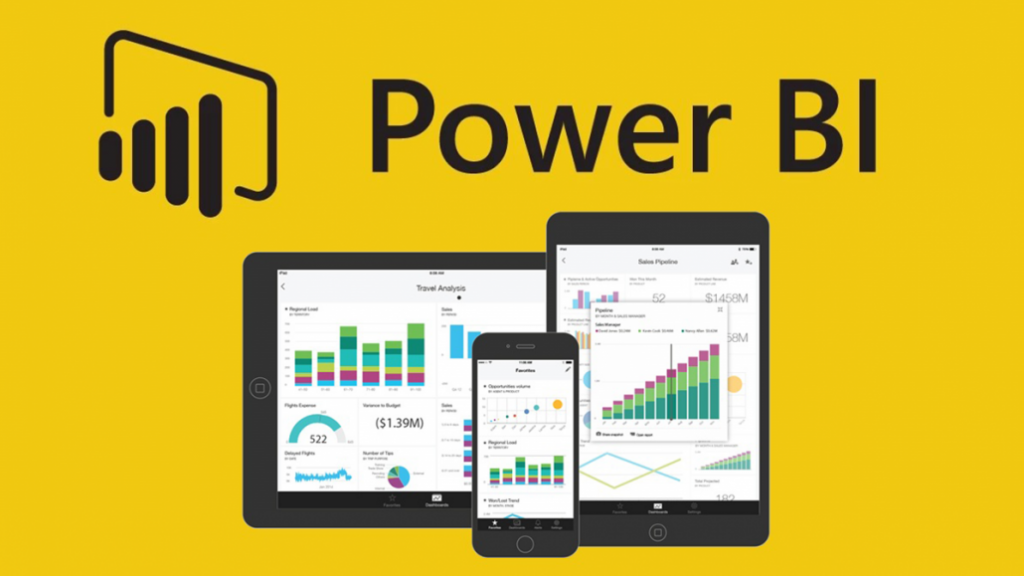
DATA ANALYTICS WITH MICROSOFT POWER BI
Power BI is the market leader in solving data management crisis, this tool is mainly aim to visualize and organize data for organizations and individuals.
Power BI is becoming the most powerful self-service business intelligence platform and an absolutely essential tool for data professionals and beginners alike.
Rich Resources.
At the end of the training, you will be able to analyse data from different data sources and create your own datasets.
100% Practical
You will have the required knowledge to dive deeper into Power BI for Data analysis and find out more about its advance features
Trusted by thousands
You will comfortably work with the different tools of the power BI and know how the different tools work together.
Simple methods to Analyze data with Power BI and gain Insights. Automate manual reporting processes with Power BI
Make reports available to stakeholders 24/7 on all devices. Select the appropriate charts for visualization (Data Visualization)
Create links in reports with Book Marks (Data Visualization). Design Interactive Reports and Dashboards (Data Visualization)
What you'll learn
Logical steps to build Data Models from (Data Modeling & DAX). Understand concept of Fact and Dimension Tables (Data Modeling & DAX)
Simplified methods to write your own DAX Measures (Data Modeling & DAX) Build your Calendar/Date Table from Scratch with DAX (Data Modeling & DAX)
Combine multiple Excel Workbooks (Data Preparation) Combine Multiple Excel Worksheets (Data Preparation) Master the rules for Data Preparation (Data Preparation)


See What's Included in This Training That Will Boost Your Career
Understanding key concepts in Business Intelligence, Data Analysis and Data visualization
Overview of PowerBI functionalities and service I Connecting to and importing data I Transforming and Modeling Data I Power BI Desktop Queries I Shaping and Combining Data I Relationships I DAX Queries I Enriching Data with Business Calculation I Visualizing Data
Visualizing Data and Authoring Reports
Report automated refresh scheduling I Creating Dashboards based on Reports and Natural Language Queries I Publishing and sharing Dashboards I Creating and leveraging on custom visualizations in Microsoft PowerBI
Recap lessons
Live individual presentation of P I Feedback and guide on how to present Data visualization projects

See What People are Saying...
You don’t want to miss this Limited time offer To Become Competent Data Analyst.
Training Platform: ZOOM App
Training Schedule:
Saturdays, and Sundays
Time: 5:00pm – 7:00pm
What's included?
The Curriculum
PROJECT OBJECTIVE #1: Connect & Transform the Raw Data
- Intro to the Power BI Query Editor
- Types of Power BI Data Connectors
- Basic Table Transformations
- Text, Number & Date Tools
- Index & Conditional Columns
- Grouping & Aggregating Data
- Pivoting & Unpivoting
- Modifying, Merging & Appending Queries
- Connecting to Folders
- Defining Hierarchies & Categories
- Query Editing & Power BI Best Practices
PROJECT OBJECTIVE #2: Build a Relational Data Model
- Intro to Database Normalization
- Data ("Fact") Tables vs. Lookup ("Dimension") Tables
- Creating Power BI Table Relationships
- "Star" vs. "Snowflake" Schemas
- Active vs. Inactive Relationships
- Relationship Cardinality
- Connecting Multiple Data Tables
- Modifying, Merging & Appending Queries
- Connecting to Folders
- Filtering & Cross-Filtering
- Hiding Fields from the Power BI Report View
- Data Modeling & Power BI best Practices
PROJECT OBJECTIVE #3: Add Calculated Fields with DAX
- Intro to Data Analysis Expressions (DAX)
- Calculated Columns vs. Measures
- Row Context vs. Filter Context in Power BI
- DAX Syntax & Operators
- Common Power BI Functions
- Basic Date & Time Formulas
- Logical & Conditional Statements
- Joining Data with RELATED
- CALCULATE, ALL & FILTER Functions
- DAX Iterators (SUMX, AVERAGEX)
- Time Intelligence Formulas
- DAX & Power BI Best Practices
PROJECT OBJECTIVE #3: Add Calculated Fields with DAX
- Intro to the Power BI Report View
- Adding Basic Charts to Power BI Reports
- Formatting & Filtering Options
- Matrix Visuals
- Slicers & Timelines
- Cards & KPIs
- Power BI Map Visuals (Basic, Fill, ArcGIS)
- Treemaps, Lines, Areas & Gauges
- Editing Report interactions
- Adding Drillthrough Filters
- Linking to Report Bookmarks
- Using "What-If" Parameters
- Managing & Viewing Roles
- PREVIEW: Publishing to Power BI Service
- Power BI Data Viz Best Practices
Lots of Bonuses for you...
- 100+ page Power BI ebook
- Downloadable Power BI project files
- Homework exercises & quizzes
- 1-on-1 expert support
- Course Q&A forum
- 30-day money-back guarantee
- Real Life Datasets
- Live Recorded Videos for you
- Collections of Videos for you

100% Satisfaction Guaranteed
Descubre un universo de entretenimiento en Monsterwin Casino, donde cada apuesta y cada giro ofrecen experiencias únicas con gráficos llamativos y premios emocionantes.
Con Spinmama Casino Login, cada sesión se convierte en una aventura llena de giros, bonos especiales y juegos que mantienen la emoción al máximo.
Slotuna Casino te invita a sumergirte en tragamonedas originales y mesas de juego sofisticadas, garantizando diversión y oportunidades de ganar en cada momento.
Si buscas un casino seguro con promociones continuas, Signorbet Login es tu opción perfecta, combinando seguridad, juegos seleccionados y experiencias de juego inigualables.