Become a Job-Ready Data Analyst in 30 Days
Learn Power BI, Excel & SQL. Build Real Projects. Create a Portfolio. Start Applying for Data Analyst Jobs with Confidence.
Whether you’re a student, graduate, NYSC member, working professional, entrepreneur, or someone looking to switch careers, this program gives you the practical skills and real-world experience needed to begin a career in Data Analytics.
No Experience? No Problem.
You don’t need a technical background to get started.
We’ve designed this bootcamp to take you from complete beginner to confident Data Analyst through a step-by-step learning experience focused on practical projects and hands-on implementation.
By the End of This Program, You Will Be Able To:
✅ Analyze and interpret business data
✅ Build interactive dashboards using Power BI
✅ Clean and transform data using Excel and Power Query
✅ Query databases using SQL
✅ Create professional reports and visualizations
✅ Build a portfolio that showcases your skills
✅ Apply for Data Analyst jobs with confidence
What You Will Learn
Module 1: Data Analytics Foundations
- Understanding Data Analytics
- Data Types and Data Sources
- Analytics Process
- Business Intelligence Fundamentals
- Data-Driven Decision Making
Module 2: Microsoft Excel for Data Analysis
- Data Cleaning Techniques
- Formulas and Functions
- Pivot Tables
- Lookup Functions
- Data Visualization
- Dashboard Creation
Module 3: SQL for Data Analysts
- Database Fundamentals
- Writing SQL Queries
- Filtering and Sorting Data
- Joins and Relationships
- Aggregations and Reporting
Module 4: Power BI Masterclass
- Power BI Interface
- Data Import and Transformation
- Power Query
- Data Modeling
- DAX Fundamentals
- Interactive Dashboards
- Publishing Reports
Module 5: Portfolio Projects
Build real-world projects using business datasets including:
- Sales Performance Dashboard
- Customer Analytics Dashboard
- Financial Reporting Dashboard
- HR Analytics Dashboard
- Business Intelligence Project
This is the Surefire Way to Learn Data Analytics Without getting confused, frustrated or overwhelmed!
Build a Portfolio Employers Want to See
Most people watch tutorials and remain stuck.
In this program, you’ll build practical projects that demonstrate your ability to solve real business problems using data.
Your completed projects can be included in your portfolio, LinkedIn profile, CV, and job applications.
Here are What You’ll Find in The Data Analytics Course Bundle.
- A Complete Ms Power BI Package
- Complete ebooks on Power BI
Lots of Bonuses for you...
- 100+ page Power BI ebook
- Downloadable Power BI project files
- Homework exercises & quizzes
- 1-on-1 expert support
- Course Q&A forum
- 30-day money-back guarantee
- Real Life Datasets
- Live Recorded Videos for you
- Collections of Videos for you
What's included?
The Curriculum
PROJECT OBJECTIVE #1: Connect & Transform the Raw Data
- Intro to the Power BI Query Editor
- Types of Power BI Data Connectors
- Basic Table Transformations
- Text, Number & Date Tools
- Index & Conditional Columns
- Grouping & Aggregating Data
- Pivoting & Unpivoting
- Modifying, Merging & Appending Queries
- Connecting to Folders
- Defining Hierarchies & Categories
- Query Editing & Power BI Best Practices
PROJECT OBJECTIVE #2: Build a Relational Data Model
- Intro to Database Normalization
- Data ("Fact") Tables vs. Lookup ("Dimension") Tables
- Creating Power BI Table Relationships
- "Star" vs. "Snowflake" Schemas
- Active vs. Inactive Relationships
- Relationship Cardinality
- Connecting Multiple Data Tables
- Filtering & Cross-Filtering
- Hiding Fields from the Power BI Report View
- Data Modeling & Power BI best Practices
PROJECT OBJECTIVE #3: Add Calculated Fields with DAX
- Intro to Data Analysis Expressions (DAX)
- Calculated Columns vs. Measures
- Row Context vs. Filter Context in Power BI
- DAX Syntax & Operators
- Common Power BI Functions
- Basic Date & Time Formulas
- Logical & Conditional Statements
- Joining Data with RELATED
- CALCULATE, ALL & FILTER Functions
- DAX Iterators (SUMX, AVERAGEX)
- Time Intelligence Formulas
- DAX & Power BI Best Practices
PROJECT OBJECTIVE #4: Design Interactive Power BI Reports
- Intro to the Power BI Report View
- Adding Basic Charts to Power BI Reports
- Formatting & Filtering Options
- Matrix Visuals
- Slicers & Timelines
- Cards & KPIs
- Power BI Map Visuals (Basic, Fill, ArcGIS)
- Treemaps, Lines, Areas & Gauges
- Editing Report interactions
- Adding Drillthrough Filters
- Linking to Report Bookmarks
- Using "What-If" Parameters
- Managing & Viewing Roles
- PREVIEW: Publishing to Power BI Service
- Power BI Data Viz Best Practices


Who Is This Program For?
✔ Students and Recent Graduates
✔ NYSC Members
✔ Career Changers
✔ Business Owners
✔ Working Professionals
✔ Freelancers
✔ Anyone Interested in Data Analytics
What You Will Receive
🎁 Complete Power BI Training
🎁 Excel for Data Analysis Training
🎁 SQL Training
🎁 Downloadable Resources
🎁 Real Datasets
🎁 Practical Assignments
🎁 Portfolio Projects
🎁 Certificate of Completion
🎁 Access to Learning Community
🎁 Lifetime Access to Course Materials
Why Learn Data Analytics?
Organizations across industries rely on data to make decisions.
Data Analysts are among the most in-demand professionals globally, working in sectors such as:
- Banking
- Healthcare
- Telecommunications
- Government
- E-commerce
- Manufacturing
- Education
- Consulting
The ability to analyze and communicate insights from data is a valuable skill that can open new career opportunities and increase your earning potential.
Student Success Path
Week 1
Learn Data Analytics Fundamentals and Excel
Week 2
Master Data Cleaning and SQL
Week 3
Build Interactive Dashboards with Power BI
Week 4
Complete Portfolio Projects and Prepare for Job Applications
Special Launch Offer
Data Analytics Career Accelerator Bundle
Includes:
✔ Power BI Training
✔ Excel Training
✔ SQL Training
✔ Real-World Projects
✔ Portfolio Development
✔ Learning Resources
✔ Community Access
Regular Price: ₦50,000
Today Only: ₦3,000
Limited-time offer for early participants.
Start Your Data Analytics Journey Today
Stop watching random tutorials.
Stop postponing your career growth.
Gain practical skills, build real projects, create a professional portfolio, and position yourself for opportunities in Data Analytics.
Click the Button Below to Enroll Now


Become A Competent Data Analyst using Power BI
Whether you are a complete beginner or even at an intermediate level, this course will rapidly build your skills and confidence and have you doing your work in Power BI very quickly and productively.
You can go through the course with the confidence that it’s taught by a highly experienced professional who has used Power BI for over 3 years.
When you sign up, you get immediate access to the course. You can download the lessons any time and there is no hurry to start as you have LIFETIME access!
Become A Competent Power BI Developer
Mega Deal is Here...
You don’t want To Pay online with your card?
Kindly Pay 5,000 NGN Here:
0665912619
Guarantee Trust Bank
720Degree Technology and Innovation Foundation
Send your email address after payment to 08032246644 or dayo.ogundeyi@720degreehub.com
Rated 5 out of 5
This Course Helped Me to Restart My Career
Gideon Ogunkola


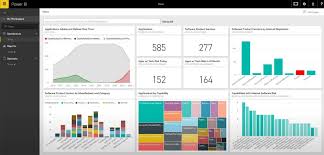
DATA ANALYTICS WITH MICROSOFT POWER BI
Power BI is the market leader in solving data management crisis, this tool is mainly aim to visualize and organize data for organizations and individuals.
Power BI is becoming the most powerful self-service business intelligence platform and an absolutely essential tool for data professionals and beginners alike.
ProX
Rich Resources.
At the end of the training, you will be able to analyse data from different data sources and create your own datasets.
100%
100% Practical
You will have the required knowledge to dive deeper into Power BI for Data analysis and find out more about its advance features
5K
Trusted by thousands
You will comfortably work with the different tools of the power BI and know how the different tools work together.


Simple methods to Analyze data with Power BI and gain Insights. Automate manual reporting processes with Power BI
Make reports available to stakeholders 24/7 on all devices. Select the appropriate charts for visualization (Data Visualization)
Create links in reports with Book Marks (Data Visualization). Design Interactive Reports and Dashboards (Data Visualization)
Logical steps to build Data Models from (Data Modeling & DAX). Understand concept of Fact and Dimension Tables (Data Modeling & DAX)
Simplified methods to write your own DAX Measures (Data Modeling & DAX) Build your Calendar/Date Table from Scratch with DAX (Data Modeling & DAX)
Combine multiple Excel Workbooks (Data Preparation) Combine Multiple Excel Worksheets (Data Preparation) Master the rules for Data Preparation (Data Preparation)


See What's Included in This Training That Will Boost Your Career
Understanding key concepts in Business Intelligence, Data Analysis and Data visualization
Overview of PowerBI functionalities and service I Connecting to and importing data I Transforming and Modeling Data I Power BI Desktop Queries I Shaping and Combining Data I Relationships I DAX Queries I Enriching Data with Business Calculation I Visualizing Data

Visualizing Data and Authoring Reports
Report automated refresh scheduling I Creating Dashboards based on Reports and Natural Language Queries I Publishing and sharing Dashboards I Creating and leveraging on custom visualizations in Microsoft PowerBI

Recap lessons
Live individual presentation of P I Feedback and guide on how to present Data visualization projects
See What People are Saying...
i'm totally new to Power BI and found this course brilliant. It was presented such that I could work along with each lecture very easily. I learned so much so thank you for providing this training.
Gideon Ogunkola
Nigeria
I have witness a major transformation in the reading culture of my children.
I want to implore the organizer to continue to raise the bar.
Kudos Sir
Blessing Akpan
Nigeria
This Course is really great!!!.
Surpassed all expectations.
I would highly recommend.
Chuks Ogei
Nigeria
Mega Deal is Here...
You don’t want to miss this Limited time offer To Become Competent Data Analyst.
What's included?
The Curriculum
PROJECT OBJECTIVE #1: Connect & Transform the Raw Data
- Intro to the Power BI Query Editor
- Types of Power BI Data Connectors
- Basic Table Transformations
- Text, Number & Date Tools
- Index & Conditional Columns
- Grouping & Aggregating Data
- Pivoting & Unpivoting
- Modifying, Merging & Appending Queries
- Connecting to Folders
- Defining Hierarchies & Categories
- Query Editing & Power BI Best Practices
PROJECT OBJECTIVE #2: Build a Relational Data Model
- Intro to Database Normalization
- Data ("Fact") Tables vs. Lookup ("Dimension") Tables
- Creating Power BI Table Relationships
- "Star" vs. "Snowflake" Schemas
- Active vs. Inactive Relationships
- Relationship Cardinality
- Connecting Multiple Data Tables
- Modifying, Merging & Appending Queries
- Connecting to Folders
- Filtering & Cross-Filtering
- Hiding Fields from the Power BI Report View
- Data Modeling & Power BI best Practices
PROJECT OBJECTIVE #3: Add Calculated Fields with DAX
- Intro to Data Analysis Expressions (DAX)
- Calculated Columns vs. Measures
- Row Context vs. Filter Context in Power BI
- DAX Syntax & Operators
- Common Power BI Functions
- Basic Date & Time Formulas
- Logical & Conditional Statements
- Joining Data with RELATED
- CALCULATE, ALL & FILTER Functions
- DAX Iterators (SUMX, AVERAGEX)
- Time Intelligence Formulas
- DAX & Power BI Best Practices
PROJECT OBJECTIVE #3: Add Calculated Fields with DAX
- Intro to the Power BI Report View
- Adding Basic Charts to Power BI Reports
- Formatting & Filtering Options
- Matrix Visuals
- Slicers & Timelines
- Cards & KPIs
- Power BI Map Visuals (Basic, Fill, ArcGIS)
- Treemaps, Lines, Areas & Gauges
- Editing Report interactions
- Adding Drillthrough Filters
- Linking to Report Bookmarks
- Using "What-If" Parameters
- Managing & Viewing Roles
- PREVIEW: Publishing to Power BI Service
- Power BI Data Viz Best Practices
Lots of Bonuses for you...
- 100+ page Power BI ebook
- Downloadable Power BI project files
- Homework exercises & quizzes
- 1-on-1 expert support
- Course Q&A forum
- 30-day money-back guarantee
- Real Life Datasets
- Live Recorded Videos for you
- Collections of Videos for you
Frequently Asked Questions
Once your payment is received, you will be redirected to the page to download the PDF files that contains all the links for the video lessons, you can access all of our courses from this link. All courses consist of video lessons that can be downloaded and viewed on your device of choice and also to truly enhance your learning you will access lots of exercise files relevant to the lessons.
Great question, we made the best training and an extension of our training is the Live recorded videos, we have competent trainers with industry experience of over 5 years using these skills in the real world!
Because the training is extremely hands-on and will provide you with a step by step that will shorten the way to your learning. YouTube videos are very interesting for you to receive extra tips or learn some tricks, but they will not make you learn in the right sequence and will not teach you the concepts of BI, which is fundamental for a solid learning.
Well, I think that better than me talking about myself, is to see what the more than 500 students already said. Take a look again at the testimonials I shared here. I have an average grade of 4.9 (0 to 5), and as you may know it is very difficult to please everyone. But if from 500 people, my average grade is 4.9, this proves that I liked and a lot who already took my courses!
You will choose me for sure! If you see the short videos I shared
If you don’t like the training, you have up to 15 (fifteen) consecutive days to cancel the subscription and request for your money. You will receive 100% of your money back, without any paperwork.
As with any new skill we want to acquire, some effort is required. But knowing this, I structured the course in a way that, in at least 60 days, you can master and apply everything that we will see in the course.

100% Satisfaction Guaranteed
This site is not a part of the Facebook (META)™ and/or Instagram™. Additionally, This site is NOT endorsed by Facebook (META)™ in any way. FACEBOOK is a trademark of FACEBOOK (META), Inc.